Definition variables in umxRAM
umx supports using definition variables in RAM models. A definition variable is a variable that takes a row-specific value in the model.
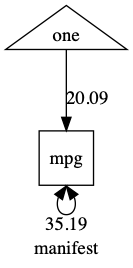
You will be used to seeing manifest variables as squares in your models, like this:
m1 = umxRAM("my manifest model",data = mtcars,
	umxPath(v.m. = "mpg")
)
plot(m1)

We add a definition variable to a model by declaring a column in our dataset to be a definition variable using the defn keyword in a umxpath statement.
Note, this model doesn’t yet serve a useful purpose: It just shows how to add a definition variable to a model.
Here’s the code:
m1 = umxRAM("manifest and definition", data = mtcars,
	umxPath(defn = "mpg"), #using mpg as a definition (makes it a latent with row-wise means)
	umxPath(v.m. = "mpg") #using mpg as a manifest (makes it regular square as expected)
)
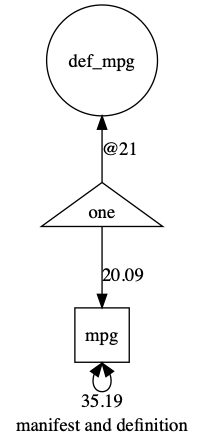
plot(m1)
And the plot:

Crucially, unlike a manifest variable, for defn, umx creates a latent variable with zero variance, and a zero average mean, but it sets the label of the variable “data.varName” (in this case “data.mpg”).
That causes umx to model each row of the dataset using the value of that row as the value for the definition variable!
You can see here the paths that are now in the model: a latent variable called def_mpg, that has no variance and has its mean set by row.
That means the model will use the subject-specific value of mpg in the model. It also means the model will drop all rows where the definition variable is NA.
mxPath def_mpg <-> def_mpg [value=0, free=FALSE, lbound=0]

mxPath one -> def_mpg [value=0, free=FALSE, label='data.mpg']
Note, to avoid confusing the latent variable created by umx with the manifest variable, umx names the latent “def_” so you can refer to the definition variable as ‘def_mpg’
If you want, you can set your own name for the definition variable:
m1 = umxRAM("my name my way", data = mtcars,
	umxPath(defn = "defMPG", label= "mpg")
)
plot(m1)

A working example
m1 = umxRAM("Model of the effect of weight on miles per gallon with transmission type as a definition variable", data = mtcars,
	umxPath(v.m. = c("wt","mpg")),
	umxPath("wt", to = "mpg"),
	umxPath(defn="am"), # creates a  latent called "def_am" with data "data.am"
	umxPath("def_am", to = c("wt", "mpg"))
)
plot(m1)
1 definition variable created: refer to it as: ‘def_am’ 1 latent variable created: def_am. Running Model of the effect of weight on miles per gallon with transmission type as a definition variable with 7 parameters ?umxSummary options: std=T|F’, digits=, report= ‘html’, filter= ‘NS’ & more
umxSummary(m1, report="html")
plot(m1)
Table: Parameter loadings for model ‘Model of the effect of weight on miles per gallon with transmission type as a definition variable’
| name | Estimate | SE | type | |
|---|---|---|---|---|
| 2 | def_am_to_mpg | -0.02 | 1.47 | Factor loading |
| 3 | def_am_to_wt | -1.36 | 0.25 | Factor loading |
| 1 | wt_to_mpg | -5.35 | 0.75 | Manifest path |
| 6 | one_to_mpg | 37.32 | 2.91 | Mean |
| 7 | one_to_wt | 3.77 | 0.16 | Mean |
| 8 | data.am | 1.00 | 0 | Mean |
| 4 | mpg_with_mpg | 8.70 | 2.17 | Residual |
| 5 | wt_with_wt | 0.48 | 0.12 | Residual |

TODO list
- A moderation example: x->y; mod-> y; x*mod->y
- The same thing using a product column (just a column containing X * Moderator for each row)
Moderation “By Hand”
# setwd("location")        # Working directory
set.seed(123)              # Standardizes the numbers generated by rnorm; see Chapter 5
N  = 100                   # Number of participants; graduate students
X  = abs(rnorm(N, 6, 4))   # IV; Hours of sleep
X1 = abs(rnorm(N, 60, 30)) # Adding some systematic variance for our DV
Z  = rnorm(N, 30, 8)       # Moderator; Ounces of coffee consumed
Y  = abs((-0.8*X) * (0.2*Z) - 0.5*X - 0.4*X1 + 10 + rnorm(N, 0, 3)) # DV; Attention Paid
Moddata = data.frame(X, X1, Z, Y)
Moddata$sleep     = X
Moddata$coffee    = Z
Moddata$Attention = Y

summary(Moddata)
Centering Data
Moddata$Xc = scale(Moddata$X, center = TRUE, scale = FALSE) # Centering IV; hours of sleep
Moddata$Zc = scale(Moddata$Z, center = TRUE, scale = FALSE) # Centering moderator; coffee consumption

Moddata$sleepC  = as.numeric(scale(Moddata$X, center = TRUE, scale = FALSE)) # Centering IV; hours of sleep
Moddata$coffeeC = as.numeric(scale(Moddata$Z, center = TRUE, scale = FALSE)) # Centering moderator; coffee consumption
Moddata$sleep_by_coffee = Moddata$sleepC*Moddata$coffeeC
Moderation “By Hand”
library(rockchalk)
library(gvlma)
fitMod = lm(Y ~ Xc + Zc + Xc*Zc) # Model interacts IV & moderator

m1 = lm(Attention ~ sleepC + coffeeC + sleepC*coffeeC, data = Moddata) # Model interacts IV & moderator
umxAPA(m1); umxAPA(m1, std=TRUE)
(Intercept) β = 0.03 [-0.07, 0.13], t = 0.67, p = 0.507 sleepC β = 0.75 [ 0.65, 0.85], t = 14.94, p < 0.001 coffeeC β = 0.35 [ 0.26, 0.45], t = 7.11, p < 0.001 sleepC:coffeeC β = 0.26 [ 0.17, 0.35], t = 5.66, p < 0.001
ps = plotSlopes(m1, plotx= "sleepC", modx= "coffeeC", xlab= "Sleep", ylab = "Attention Paid", modxVals = "std.dev")
visreg(m1, xvar = "sleepC", by = "coffeeC")

m1 = umxRAM("moderate", data = Moddata,
	umxPath(c("sleep_by_coffee", "sleepC", "coffeeC"), to = "Attention"),
	umxPath(unique.bivariate= c("sleep_by_coffee", "sleepC", "coffeeC")),
	umxPath(v.m. = c("sleep_by_coffee", "sleepC", "coffeeC", "Attention"))
)

umxSummary(m1, showEstimates = "std")
plot(m1)
| Name | CI |
|---|---|
| sleepC_to_Attention | 0.75 [0.66, 0.85] |
| coffeeC_to_Attention | 0.35 [0.25, 0.46] |
| sleep_by_coffee_to_Attention | 0.28 [0.18, 0.39] |
| Attention_with_Attention | 0.23 [0.15, 0.31] |
| coffeeC_with_sleepC | -0.13 [-0.32, 0.06] |
| sleep_by_coffee_with_sleepC | 0.16 [-0.03, 0.35] |
| coffeeC_with_sleep_by_coffee | -0.03 [-0.23, 0.17] |
χ²(0) = 0, p = 1.000; CFI = 1; TLI = 1; RMSEA = 0
Mediation
set.seed(123) # Standardizes the numbers generated by rnorm; see Chapter 5
N = 100 #Number of participants; graduate students
X = rnorm(N, 175, 7) #IV; hours since dawn
M = 0.7*X + rnorm(N, 0, 5) #Suspected mediator; coffee consumption
Y = 0.4*M + rnorm(N, 0, 5) #DV; wakefulness
Meddata = data.frame(X, M, Y)

library(mediation)
?mediate
fitM = lm(M ~ X,     data=Meddata) #IV on M; Hours since dawn predicting coffee consumption
fitY = lm(Y ~ X + M, data=Meddata) #IV and M on DV; Hours since dawn and coffee predicting wakefulness
gvlma(fitM) #data is positively skewed; could log transform (see Chap. 10 on assumptions)
gvlma(fitY)
fitMed = mediate(fitM, fitY, treat="X", mediator="M")
summary(fitMed)
plot(fitMed)
fitMedBoot = mediate(fitM, fitY, boot=TRUE, sims=999, treat="X", mediator="M")
summary(fitMedBoot)
plot(fitMedBoot)